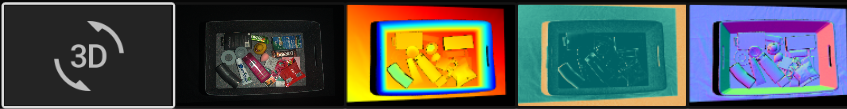
可用视图
Zivid Studio 底部有五种视图。这些视图显示以下功能:
点云
彩色图像
深度图
信噪比图
法线图
如需在视图之间导航,您可以
使用键盘快捷键 1 到 5
通过单击在GUI底部的缩略图手动更改
从左上角的下拉菜单中选择
每个视图的左上角都有一组下拉菜单,提供不同的功能供您使用。
Point Cloud(点云)
此视图显示 3D 捕获后或加载 ZDF 文件后的场景的点云。
使用鼠标左键旋转点云。
使用鼠标右键进行平移。
可通过滚动鼠标滚轮或拖动鼠标中键(如果可用)放大或缩小图像。
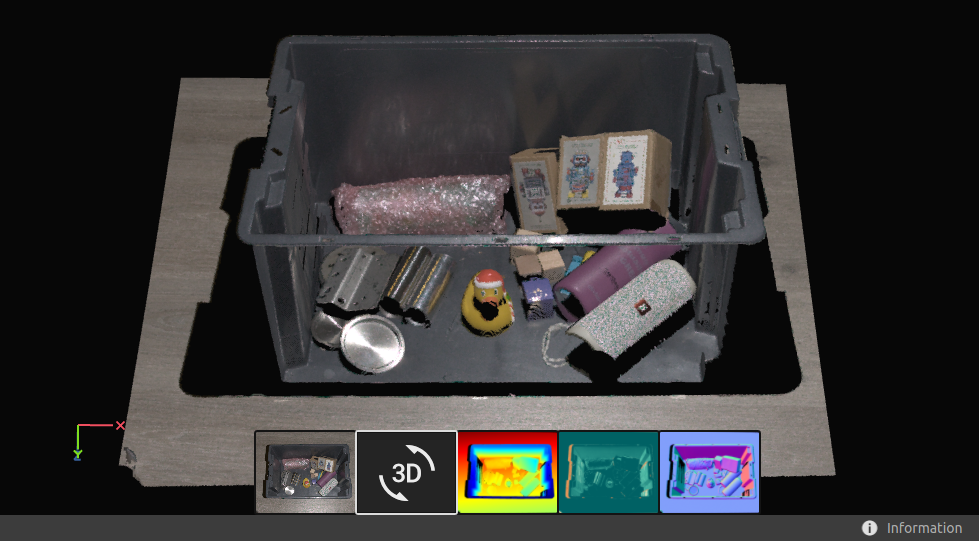
在此视图中选择点云的着色方式( C 、 D 、 R 和 S )以及打开和关闭网格化( M )有助于评估点云质量。
影响点云可视化的其他功能位于左上角的下拉菜单中:
Color(颜色)
此视图显示 2D 捕获或加载 ZDF 文件后的场景彩色图像。
将鼠标指针置于图像中的某个像素上,即可获取图像坐标和 RGB 值。像素值显示在窗口左下角的状态栏中。
可通过滚动鼠标滚轮或拖动鼠标中键(如果可用)放大或缩小图像。
使用鼠标左键平移视图。
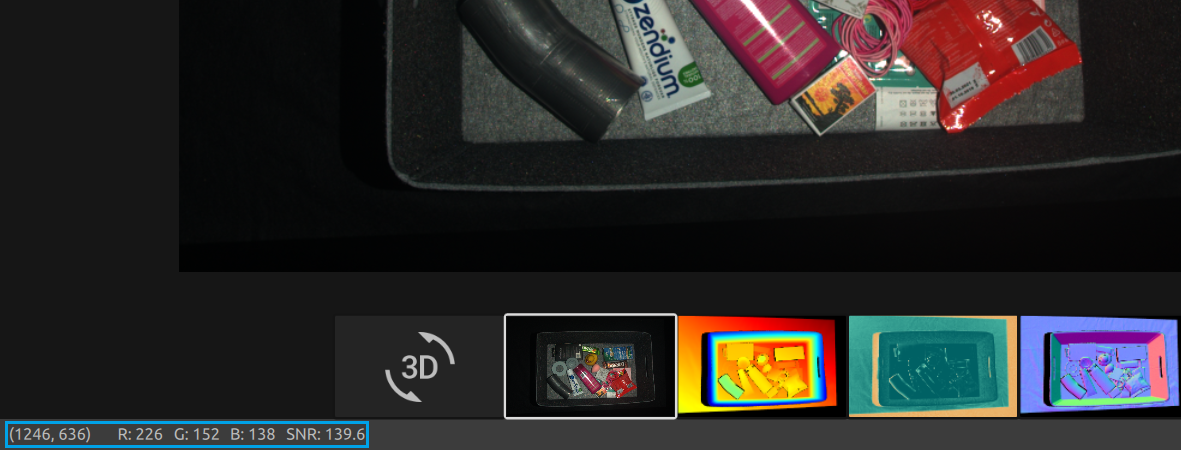
当使用不同的像素采样进行 2D+3D 捕获时,您可以在左上角的下拉菜单中在 2D 捕获和 3D 捕获的 2D 图像之间切换。
Depth(深度)
捕获或加载ZDF文件后,此视图将显示场景的深度图像。
将鼠标指针置于图像中的某个像素上,即可获取图像坐标、XYZ 值和 SNR 值 。像素值显示在窗口左下角的状态栏中。
可使用视图左上角的下拉菜单设定Z的范围。
可以使用在 颜色视图 中描述的同样的方法来进行图像的缩放和平移。
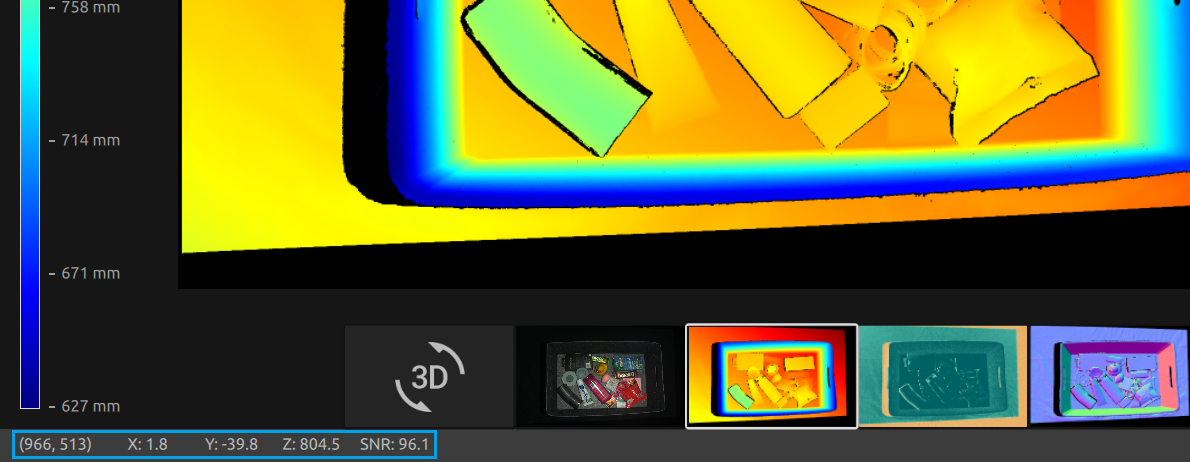
色标表示从相机到成像物体表面沿 z 轴的距离变化。要修改沿 z 轴的范围,您可以使用左上角下拉菜单中的固定 Z 范围来缩小色标。
SNR(信噪比)
此视图将在捕获或加载ZDF文件后显示场景的SNR图。
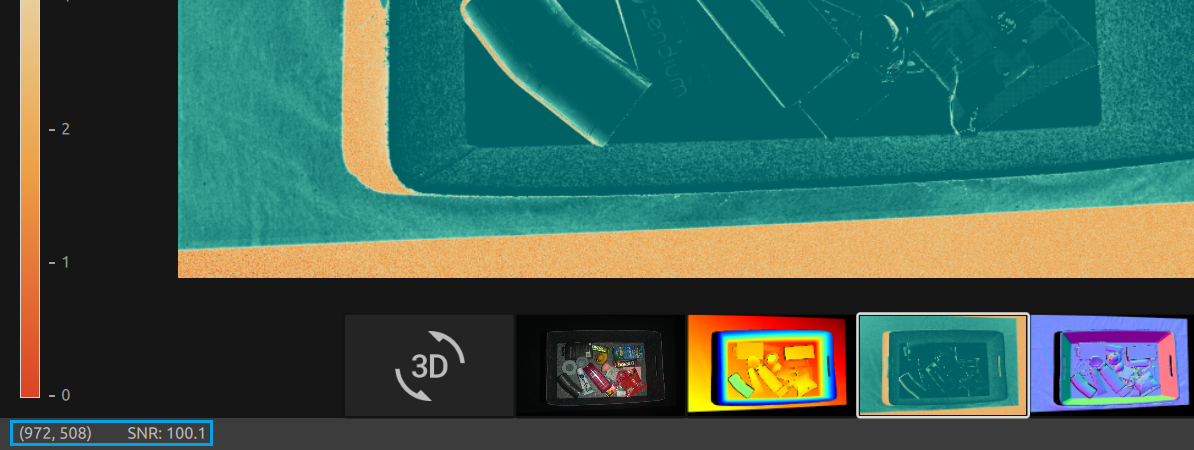
颜色标度表示 SNR 值 的变化。更接近颜色标度上端的像素表示这些像素上的信号强度更强。对于与位于靠近颜色标度下端的像素点,该比率受噪声的影响更大。因此,这些点有着更高的不确定性。
如需了解更多详细内容,请参阅 SNR 值 。
Normals(法线)
此视图将在捕获或加载ZDF文件后显示场景的法线图。
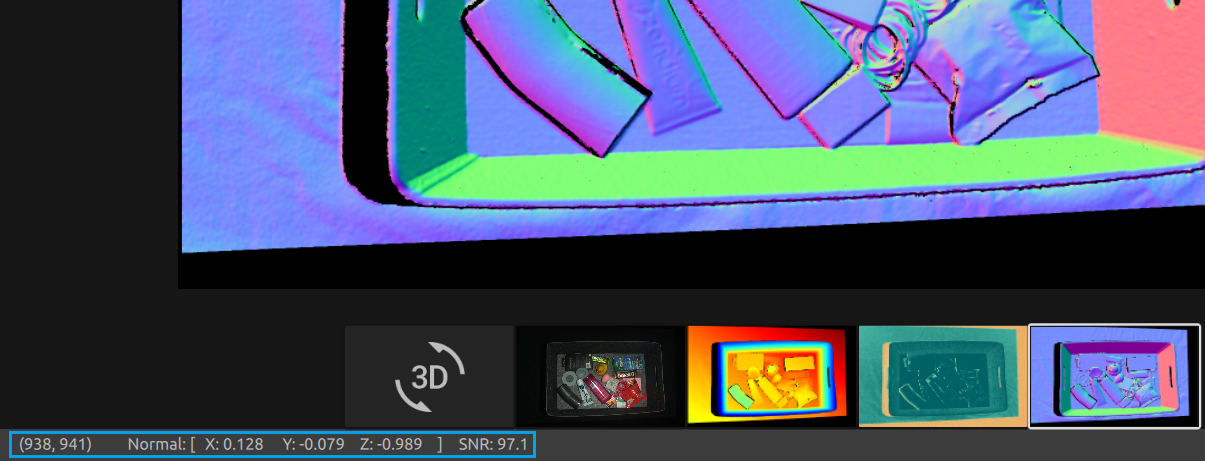
法线图提供了场景表面法线的 2D 表示,其中 RGB 颜色分量描述法线向量。它有助于检查表面曲率、表面纹理和物体之间的过渡,因为颜色渐变可以很好地描述这些。
有关法线的介绍,请参阅 法线 一文。
继续阅读有关 Zivid Studio 的内容: 工具栏 。
版本历史
SDK |
变更 |
|---|---|
2.15.0 |
在3D视图中添加SNR彩色图,并添加Transform对点云进行变换。 |
2.14.0 |
3D 视图中添加了 3D 轴指示器、彩虹色图和更多点尺寸选项。 |
2.8.0 |
增加了调整的点大小的功能、SNR图和法线图。 |