Available Views
Zivid Studio 하단에는 5개의 뷰가 있습니다. 이러한 보기에는 다음 기능이 표시됩니다.
The point cloud(포인트 클라우드)
The color image(컬러 이미지)
The depth map(깊이 맵)
The SNR map(SNR 맵)
The normal map(노멀 맵)
보기 모드를 전환은 다음 중 하나의 방법으로 수행할 수 있습니다
1 ~ 5 의 키보드 단축키를 사용합니다
GUI 하단에서 있는 썸네일을 클릭하여 수동으로 변경합니다
왼쪽 상단의 드롭다운 메뉴에서 선택합니다
각 뷰의 왼쪽 상단에는 다양한 기능을 탐색할 수 있는 드롭다운 메뉴가 각각 있습니다.

Point Cloud
이 보기에서는 3D 캡처 후 또는 ZDF 파일을 로드한 후의 장면의 포인트 클라우드가 표시됩니다.
마우스 왼쪽 버튼을 사용하여 포인트 클라우드를 회전합니다.
마우스 오른쪽 버튼을 사용하여 이동합니다.
마우스 휠을 굴리거나 마우스 가운데 버튼을 누른 다음 마우스를 끌어 확대 또는 축소합니다.
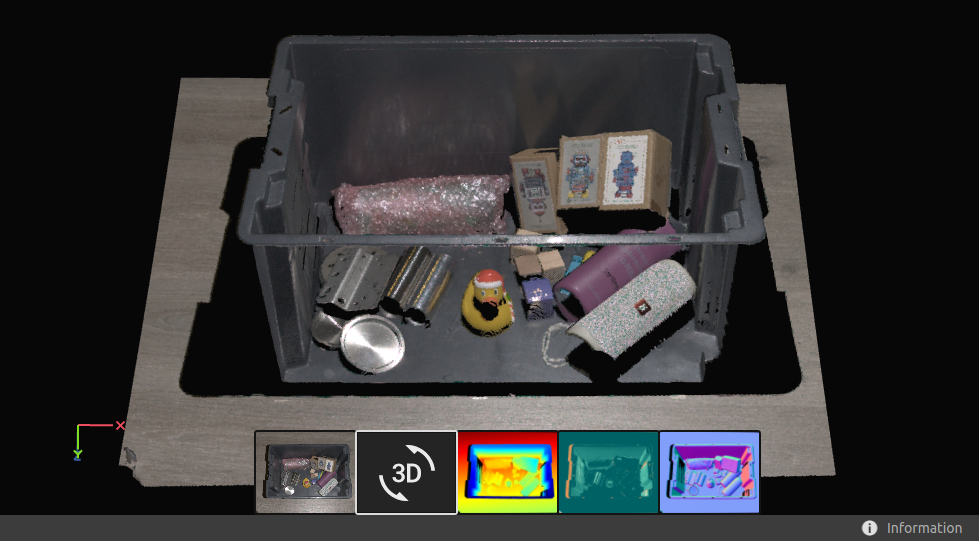
이 보기에서 포인트 클라우드의 색상 지정 방식(C, D, R 및 S)을 선택하고 메시(M)를 켜고 끄면 포인트 클라우드 품질을 평가하는 데 도움이 됩니다.
포인트 클라우드의 시각화에 영향을 미치는 다른 기능은 왼쪽 상단 드롭다운 메뉴에서 찾을 수 있습니다.
포인트 크기를 조절할 수 있어 질감이 중요한 영역을 검사하는 데 도움이 될 수 있습니다.
깊이(D) 포인트 클라우드 색칠이 활성화된 경우 Z 범위를 조정하여 포인트 클라우드의 특정 섹션만 표시할 수 있습니다.
변환을 포인트 클라우드에 적용하여, 모든 포인트를 카메라 좌표계에서 원하는 좌표계로 변환할 수 있습니다. 이는 다양한 컬러 모드와 함께 사용하여 포인트 클라우드를 검사할 때 유용할 수 있습니다. 변환은 파일에서 불러오거나 관심 영역(Region Of Interest)을 통해 설정할 수 있습니다. 이 설정은 Depth 및 Normals 뷰에도 영향을 미치는데, 이는 현재 좌표계를 기준으로 하기 때문입니다.
자세한 내용은 Transform 에서 확인하세요.
Region Of Interest Box 를 활성화한 경우 해당 박스의 표시 여부 수정할 수 있습니다.
Color
이 보기에서는 2D 캡처 후 또는 ZDF 파일을 로드한 후의 장면의 컬러 이미지가 표시됩니다.
이미지의 픽셀 위에 마우스 포인터를 올려놓으면 이미지 좌표와 RGB 값을 얻을 수 있습니다. 픽셀 값은 창의 왼쪽 하단 모서리에 있는 상태 표시줄에 표시됩니다.
마우스 휠을 굴리거나 마우스 가운데 버튼을 누른 다음 마우스를 끌어 확대 또는 축소합니다.
왼쪽 마우스 버튼을 사용하여 보기를 이동합니다.
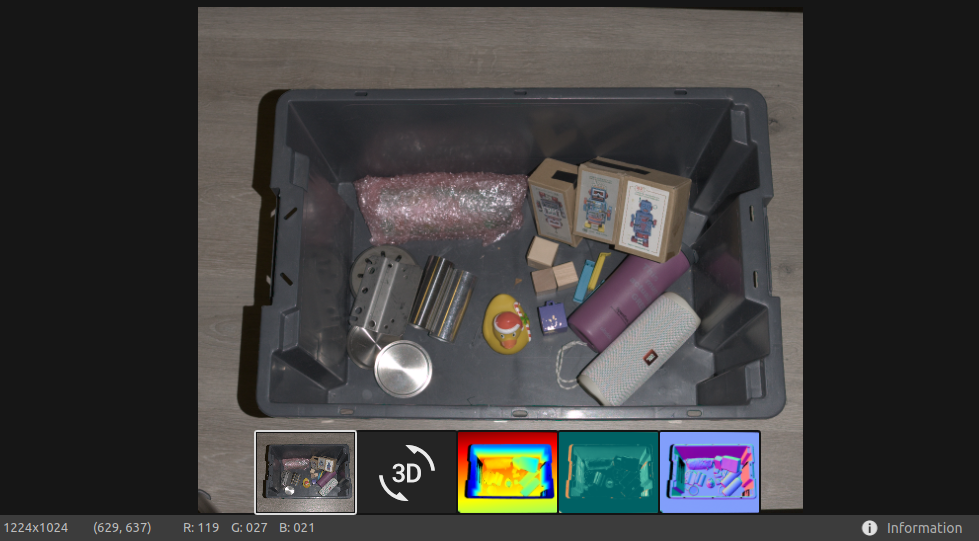
다양한 픽셀 샘플링을 사용하여 2D+3D 캡처를 할 때, 왼쪽 상단 드롭다운에서 2D 캡처의 2D 이미지와 3D 캡처의 2D 이미지 간을 전환할 수 있습니다.
Depth
이 보기는 캡처 후 또는 ZDF 파일을 로드한 후 장면의 depth 이미지를 표시합니다.
이미지의 픽셀 위에 마우스 포인터를 올려놓으면 이미지 좌표, XYZ 값, SNR values 을 얻을 수 있습니다. 픽셀 값은 창의 왼쪽 하단 모서리에 있는 상태 표시줄에 표시됩니다.
왼쪽 상단에 있는 드롭다운 메뉴를 사용하여 Z 범위를 수정합니다.
Color View 에서 설명한 것과 같은 방식으로 확대/축소 및 팬 기능을 사용합니다.
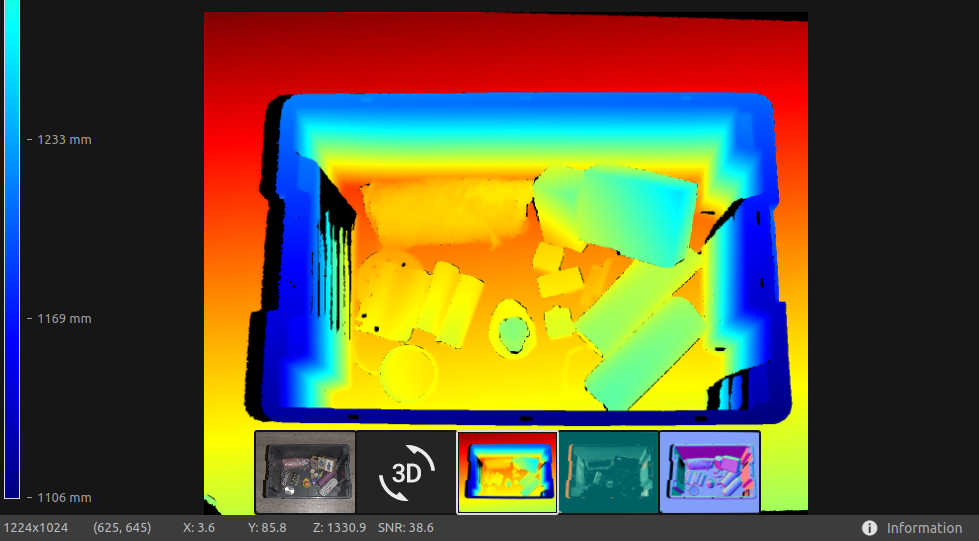
색상 스케일은 카메라에서 이미지화된 객체 표면까지의 z축을 따라 거리 변화를 나타냅니다. z축을 따라 범위를 수정하려면 왼쪽 위 드롭다운에서 고정된 Z 범위를 사용하여 색상 스케일을 좁힐 수 있습니다.
Signal-to-Noise-Ratio
이 보기는 캡처 후 또는 ZDF 파일을 로드한 후 장면의 SNR 맵을 표시합니다.
이미지 좌표 및 SNR values 을 알고 싶은 픽셀에 마우스를 올리면 창의 왼쪽 하단 모서리에 있는 상태 표시줄에 정보가 표시됩니다.
Color View 에서 설명한 것과 같은 방식으로 확대/축소 및 팬 기능을 사용합니다.
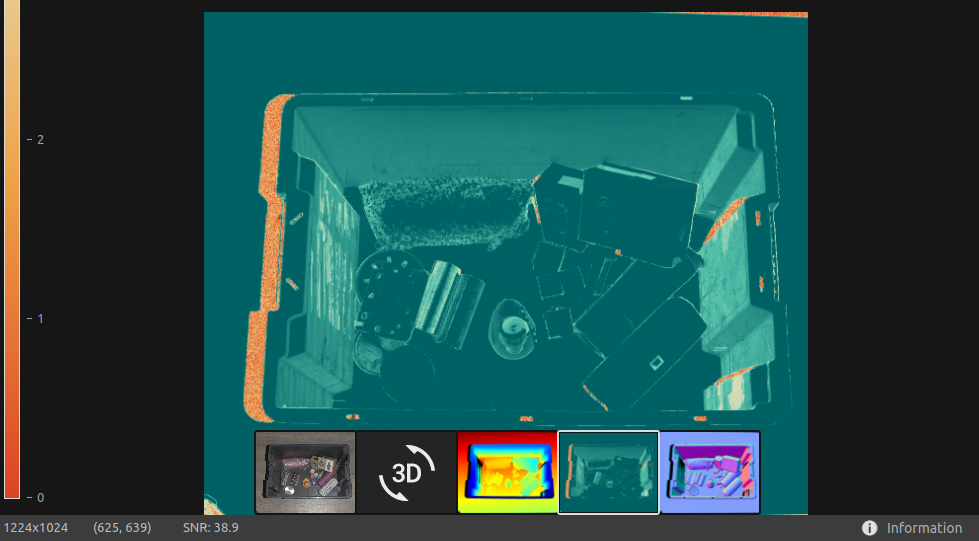
색상 스케일은 SNR values 의 변화를 나타냅니다. 색상 스케일의 상위 끝에서 발견된 픽셀은 강한 신호 품질과 관련된 지점을 나타냅니다. 색상 스케일의 하위 끝에서 발견된 픽셀과 관련된 지점의 경우 비율은 노이즈의 영향을 더 많이 받습니다. 따라서 이러한 지점은 더 높은 불확실성을 수반합니다.
자세한 설명은 SNR values Article 을 참조하세요.
Normals
이 보기는 캡처 후 또는 ZDF 파일을 로드한 후 장면의 노멀 맵을 표시합니다.
이미지 좌표, 일반 좌표 및 SNR values 을 알고 싶은 픽셀에 마우스를 올리면 창의 왼쪽 하단 모서리에 있는 상태 표시줄에 정보가 표시됩니다.
Color View 에서 설명한 것과 같은 방식으로 확대/축소 및 팬 기능을 사용합니다.
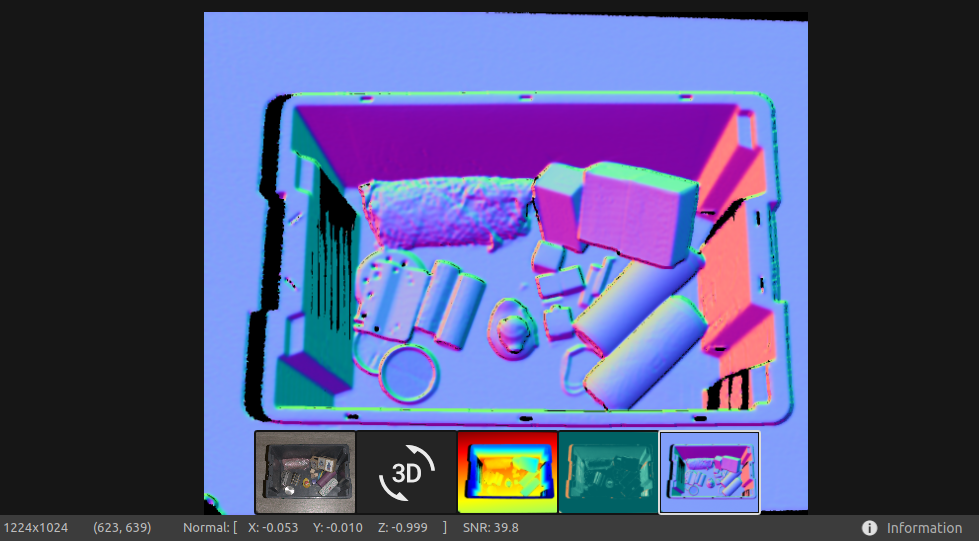
Normal 맵은 RGB 색상 구성 요소가 노멀 벡터를 설명하는 장면의 표면 노멀에 대한 2D 표현을 제공합니다. 색상 그래디언트가 이를 잘 설명하므로 표면 곡률, 표면 텍스처 및 객체 간 전환을 검사하는 데 유용합니다.
Normals에 대한 소개는 Normals Article 을 참조하세요.
Toolbar 에서 Zivid Studio에 대한 내용을 계속 읽어보세요.
Version History
SDK |
Changes |
|---|---|
2.15.0 |
SNR 색상 맵이 3D 뷰에 추가되고, 변환이 추가되어 포인트 클라우드를 변환합니다. |
2.14.0 |
3D 축 표시기, 무지개 색상 맵 및 더 많은 포인트 크기가 3D 보기에 추가되었습니다. |
2.8.0 |
조정 가능한 포인트 크기, SNR 맵, 노멀 맵이 추가되었습니다. |