Unsatisfactory Hand-Eye Calibration Results (Loose, Sagging, or Vibrating Calibration Board)
Problem
The hand-eye calibration results are unsatisfactory (bad or marginal), looking like something between these combinations:
Hand-Eye Transform |
Hand-Eye Residuals |
Projection Verification |
Touch Test |
|---|---|---|---|
Reasonable |
Bad |
Bad |
Bad |
Reasonable |
Marginal |
Poor |
Bad |
Example of marginal hand-eye calibration results
The Hand-Eye Transformation Matrix appears reasonable and is consistent with what one would expect from rough manual measurements (see table and image below).
0.01 |
1.00 |
0.02 |
-23.06 |
1.00 |
-0.01 |
0.06 |
440.37 |
0.06 |
0.02 |
-1.00 |
1969.85 |
0.00 |
0.00 |
0.00 |
1.00 |
The calibration residuals are slightly larger than expected.
N (Poses) |
Rot. avg (°) |
Rot. max (°) |
Trans. avg (mm) |
Trans. max (mm) |
|---|---|---|---|---|
16 |
0.24 |
0.79 |
0.68 |
1.48 |
For smaller robots, we expect the residuals to in the sub-millimeter range, while for larger robots, the residuals can be in the millimeter range. As for the rotational component of the residuals, we expect them to be in the sub-degree range.
Complete Residuals
Pose |
Rotation (°) |
Translation (mm) |
|---|---|---|
1 |
0.04 |
0.78 |
2 |
0.74 |
1.46 |
3 |
0.17 |
0.72 |
4 |
0.10 |
0.72 |
5 |
0.15 |
0.51 |
6 |
0.12 |
0.51 |
7 |
0.22 |
0.60 |
8 |
0.11 |
0.26 |
9 |
0.12 |
0.26 |
10 |
0.16 |
0.54 |
11 |
0.27 |
0.91 |
12 |
0.14 |
0.73 |
13 |
0.20 |
0.58 |
14 |
0.79 |
1.48 |
15 |
0.21 |
0.44 |
16 |
0.30 |
0.34 |
Verification by Projection technically succeeds, but the resulting error is still too large to be acceptable. One should be very critical of projection verification, as the projection error may seem acceptable even if the hand-eye calibration is incorrect.
The touch test result is unsatisfactory. For example, the tip of the touch test tool does not reach the ArUco marker.
Potential Cause
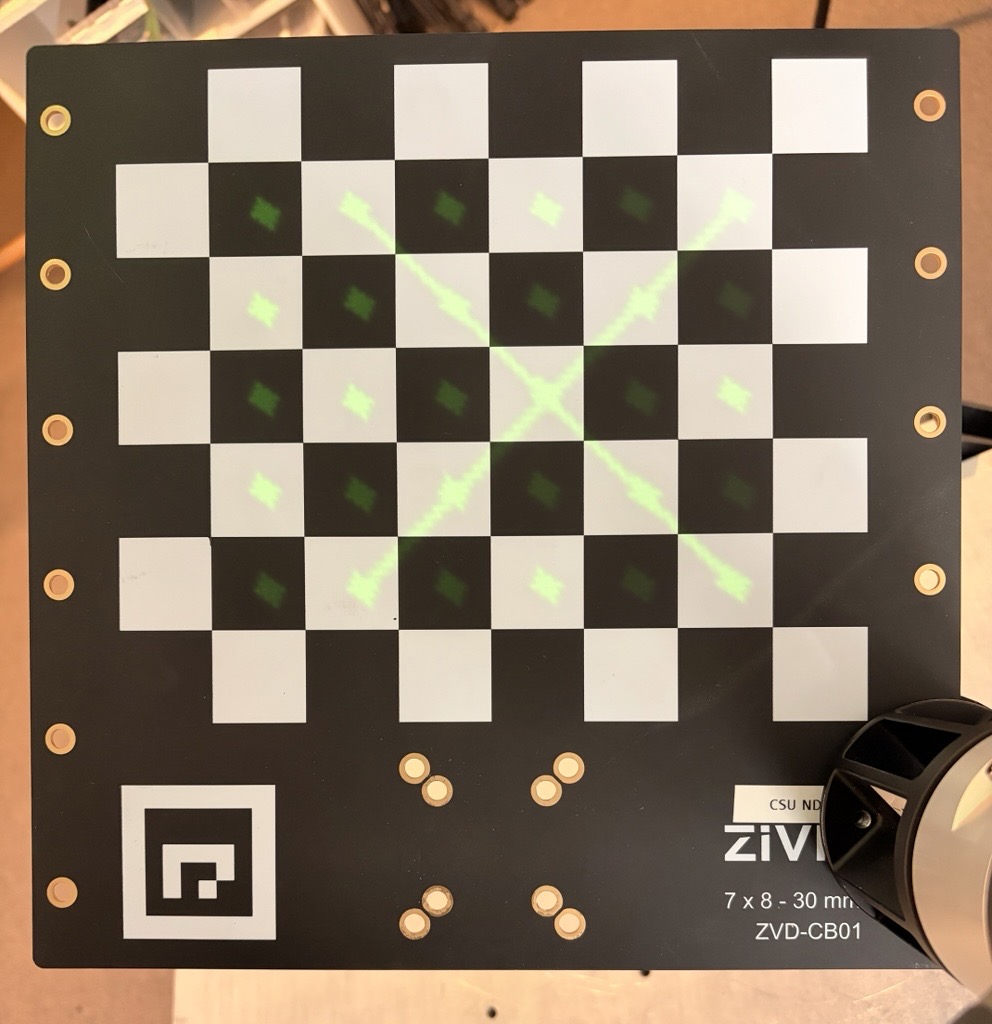
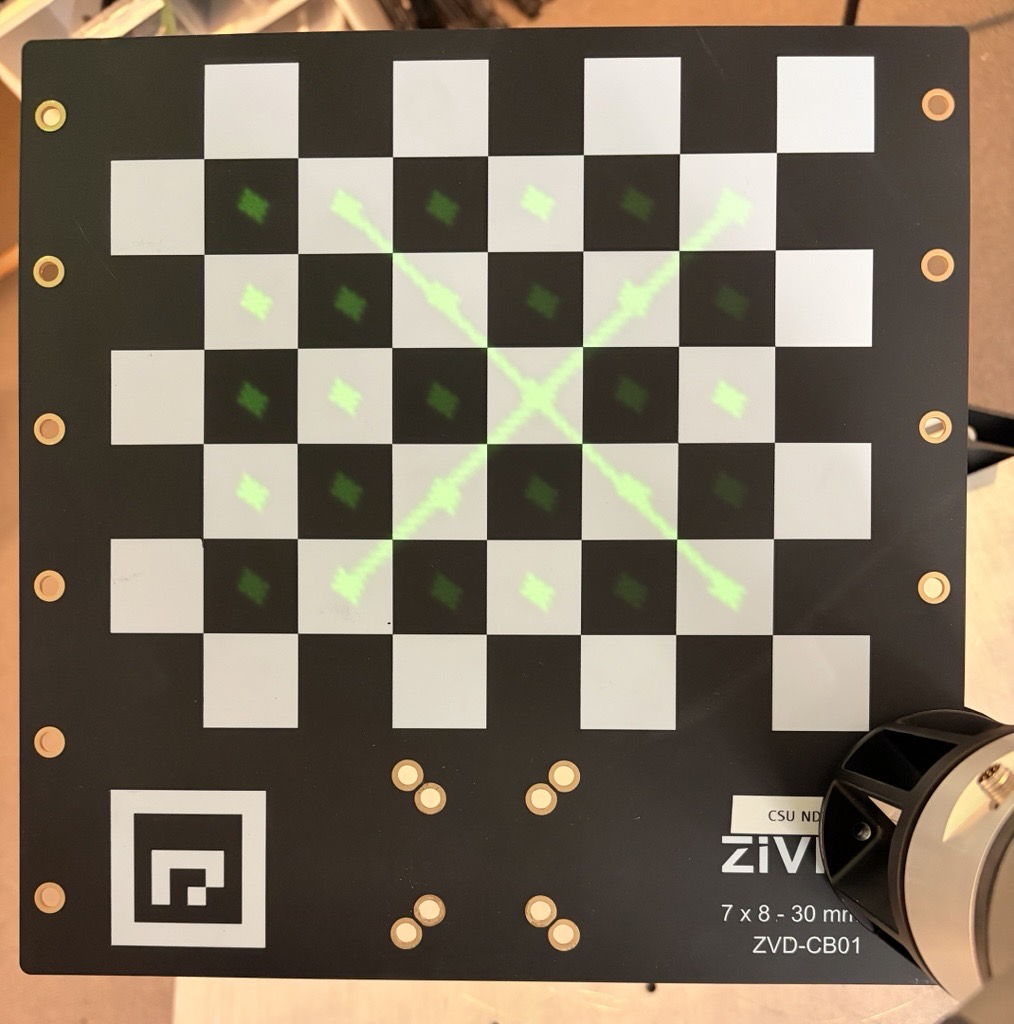
A common cause of high residuals is flex or movement in the on-arm mounting structure that connects the robot flange to the calibration board, or in the calibration board itself. This can cause the calibration board to still vibrate while the camera captures it or to be slightly shifted across camera captures. Both of these factors directly affect the accuracy of the hand-eye calibration results.
This can occur when:
The robot acceleration is too high
The delay is too short before capturing to let the calibration board vibration settle
The bracket holding the calibration board is 3D-printed, thin, or otherwise insufficiently rigid
Screws or fasteners are not properly tightened
The mount sags, bends, or shifts as the robot changes orientation
Any mechanical movement during dataset acquisition results in the calibration board appearing in slightly different poses, which directly increases residuals.
Potential Solution
Ensure that the calibration board is completely still during dataset acquisition:
Keep the robot acceleration low during the dataset acquisition
Add sufficient delay after the robot reaches its target pose before capturing
Ensure that the mounting interface between the robot flange and the calibration board is completely rigid:
Use a solid metal bracket or another high-stiffness material
Avoid 3D-printed, thin, or long cantilevered designs
Verify that all screws, adapters, and extension plates are fully tightened
If necessary, shorten the lever arm or reinforce the mount
Repeat the hand-eye calibration using the same dataset.
Verify the hand-eye calibration results (transform, residuals, projection).
Run the touch test (if the hand-eye calibration results are good).
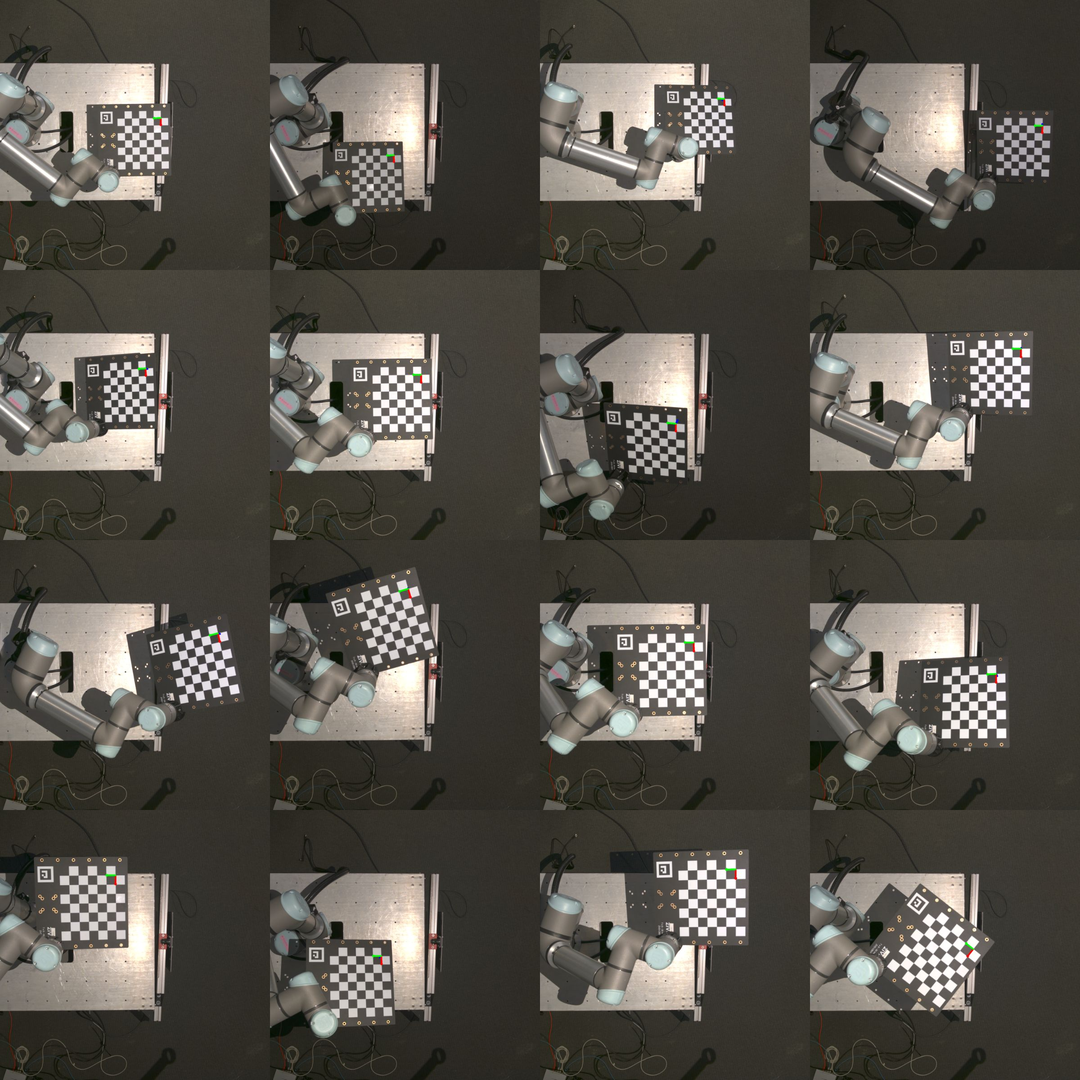
Reproducing the issue (vibrating calibration board)
Good Dataset
A hand-eye calibration was successfully performed using the dataset shown in the images below.
The calibration resulted in the following results:
0.01 |
1.00 |
0.02 |
-24.28 |
1.00 |
-0.01 |
0.06 |
442.41 |
0.06 |
0.02 |
-1.00 |
1969.45 |
0.00 |
0.00 |
0.00 |
1.00 |
N (Poses) |
Rot. avg (°) |
Rot. max (°) |
Trans. avg (mm) |
Trans. max (mm) |
|---|---|---|---|---|
16 |
0.06 |
0.11 |
0.34 |
0.65 |
Complete Residuals
Pose |
Rotation (°) |
Translation (mm) |
|---|---|---|
1 |
0.03 |
0.56 |
2 |
0.06 |
0.65 |
3 |
0.11 |
0.34 |
4 |
0.06 |
0.08 |
5 |
0.05 |
0.64 |
6 |
0.03 |
0.06 |
7 |
0.07 |
0.36 |
8 |
0.06 |
0.18 |
9 |
0.07 |
0.14 |
10 |
0.04 |
0.19 |
11 |
0.05 |
0.29 |
12 |
0.09 |
0.34 |
13 |
0.06 |
0.21 |
14 |
0.07 |
0.33 |
15 |
0.06 |
0.46 |
16 |
0.06 |
0.62 |
Verification by Projection was successful.
The Hand-Eye calibration was then verified with a touch test.
The touch test was successful, which confirms that the hand-eye calibration is correct and accurate.
Bad Dataset (vibrating calibration board)
The same dataset was used for hand-eye calibration. However, the acceleration of the robot was intentionally increased to simulate a vibrating calibration board during the dataset acquisition. The delay after the robot reached its target pose before capturing was also intentionally shortened to further simulate the effect of a vibrating calibration board.
The calibration resulted in the following results:
0.01 |
1.00 |
0.02 |
-23.06 |
1.00 |
-0.01 |
0.06 |
440.37 |
0.06 |
0.02 |
-1.00 |
1969.85 |
0.00 |
0.00 |
0.00 |
1.00 |
N (Poses) |
Rot. avg (°) |
Rot. max (°) |
Trans. avg (mm) |
Trans. max (mm) |
|---|---|---|---|---|
16 |
0.24 |
0.79 |
0.68 |
1.48 |
Complete Residuals
Pose |
Rotation (°) |
Translation (mm) |
|---|---|---|
1 |
0.04 |
0.78 |
2 |
0.74 |
1.46 |
3 |
0.17 |
0.72 |
4 |
0.10 |
0.72 |
5 |
0.15 |
0.51 |
6 |
0.12 |
0.51 |
7 |
0.22 |
0.60 |
8 |
0.11 |
0.26 |
9 |
0.12 |
0.26 |
10 |
0.16 |
0.54 |
11 |
0.27 |
0.91 |
12 |
0.14 |
0.73 |
13 |
0.20 |
0.58 |
14 |
0.79 |
1.48 |
15 |
0.21 |
0.44 |
16 |
0.30 |
0.34 |
Verification by Projection technically succeeded, but the resulting error was still too large to be acceptable. One should be very critical of projection verification, as the projection error may seem acceptable even if the hand-eye calibration is incorrect.
The touch test result was unsatisfactory as the tip of the touch test tool did not reach the ArUco marker.
Comparisons
The results between hand-eye calibration matrices (translation values) and hand-eye calibration residuals are compared in the tables below.
Dataset |
X (mm) |
Y (mm) |
Z (mm) |
|---|---|---|---|
Good (Still) |
-24.28 |
442.41 |
1969.45 |
Bad (Vibrating) |
-23.06 |
440.37 |
1969.85 |
Δ (Good - Bad) |
-1.22 |
2.04 |
-0.40 |
Dataset |
N |
Rot. avg (°) |
Rot. max (°) |
Trans. avg (mm) |
Trans. max (mm) |
|---|---|---|---|---|---|
Good (Still) |
16 |
0.06 |
0.11 |
0.34 |
0.65 |
Bad (Vibrating) |
16 |
0.24 |
0.79 |
0.68 |
1.48 |