Available Views
There are five views available at the bottom of Zivid Studio.
ビュー間の切り替え方法:
Use the keyboard shortcuts 1 through 5.
Change manually at the bottom of the GUI by clicking on the thumbnails.
Select from the drop-down menu in the top left corner.
Each view has its own set of drop-down menus in the top left corner with different features to explore.

3D View
このビューは 3D キャプチャ後、または ZDF ファイル読み込み後のシーン点群を表示します。
マウスの左ボタンを使用して点群を回転します。
マウスの右ボタンを使用してパンします。
マウスホイール回転、または中ボタン+ドラッグでズームイン / ズームアウトします。
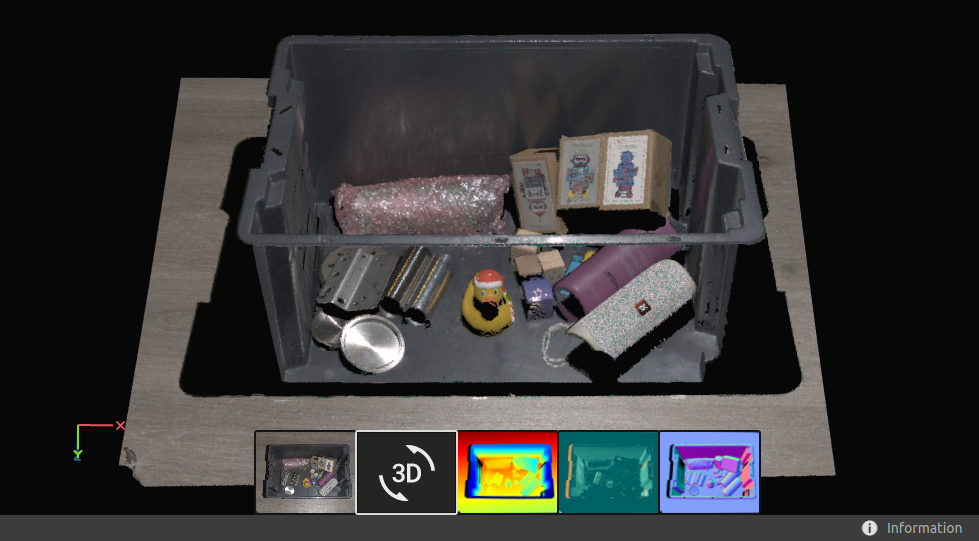
Choosing how the point cloud is colored (C, D, R and S) and toggling the mesh (M) on and off in this view helps evaluate the point cloud quality.
Other features that affect the visualization of the point cloud are found in the top left drop-down menus:
点サイズは調整可能で、テクスチャが重要な領域の確認に有用です。
If Depth (D) point cloud coloring is enabled, you can adjust the Z range to display only a specific section of the point cloud.
A transform can be applied to the point cloud, moving all points from the camera's coordinate system to a chosen one. Load the transform from file, or set it with the Region Of Interest.
注釈
This also affects the Depth and Normals views, since they are relative to the current coordinate system.
詳細は Transform を参照してください。
関心領域ボックス を有効にしている場合は表示の有無を変更できます。
2D Color Image
このビューは 2D キャプチャ後、または ZDF ファイル読み込み後のシーンのカラー画像を表示します。
画像のピクセルの上にマウスポインターを置くと、画像の座標と RGB 値が表示されます。ピクセル値は、ウィンドウの左下隅にあるステータスバーに表示されます。
マウスホイール回転、または中ボタン+ドラッグでズームイン / ズームアウトします。
左ボタンでパンします。
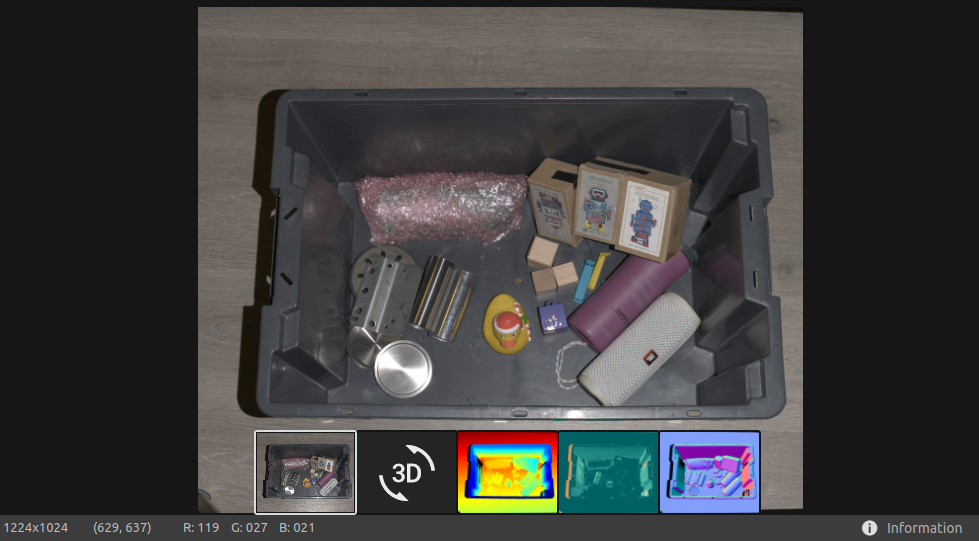
ピクセルサンプリングが異なる 2D+3D キャプチャ時は、左上ドロップダウンで 2D キャプチャ画像と 3D キャプチャ表示を切り替えられます。
Depth
このビューはキャプチャ後、または ZDF ファイル読み込み後のシーン深度画像を表示します。
マウスポインターを画像内のピクセルの上に置くと、画像座標、XYZ 値、および SN比値 が取得されます。ピクセル値は、ウィンドウの左下隅のステータスバーに表示されます。
Z 範囲を変更するには、ビューの左上隅にあるドロップダウンメニューを使用します。
Use zoom and pan features in the same way as described in the Color View.
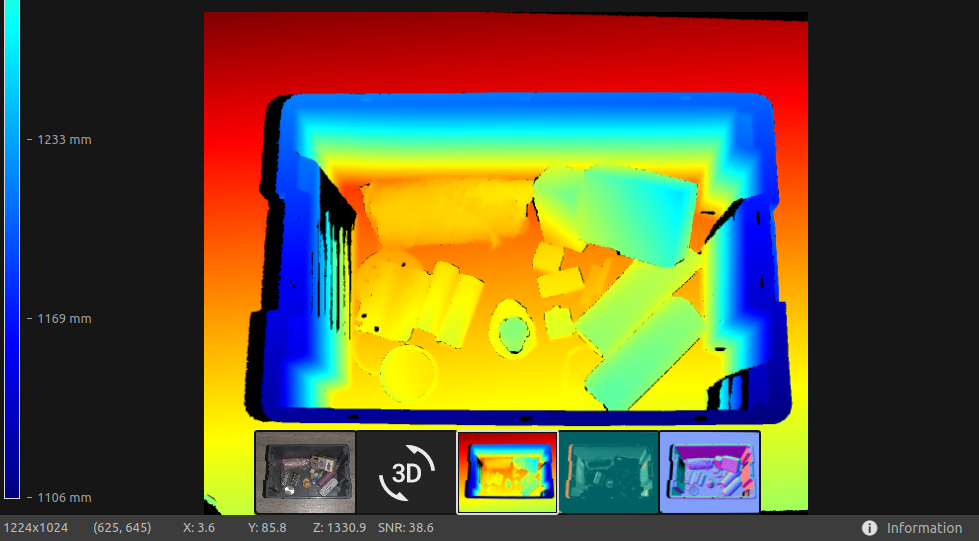
カラースケールはカメラから対象表面までの Z 軸方向距離変化を表します。Z 軸範囲は左上ドロップダウンで固定値を選択しスケールを絞り込めます。
Signal-to-Noise-Ratio
このビューはキャプチャ後、または ZDF ファイル読み込み後のシーンの SN 比マップを表示します。
画像上のピクセルにマウスポインターを重ねると座標と SN比値 を取得します。取得値は左下ステータスバーに表示されます。
Use zoom and pan features in the same way as described in the Color View.
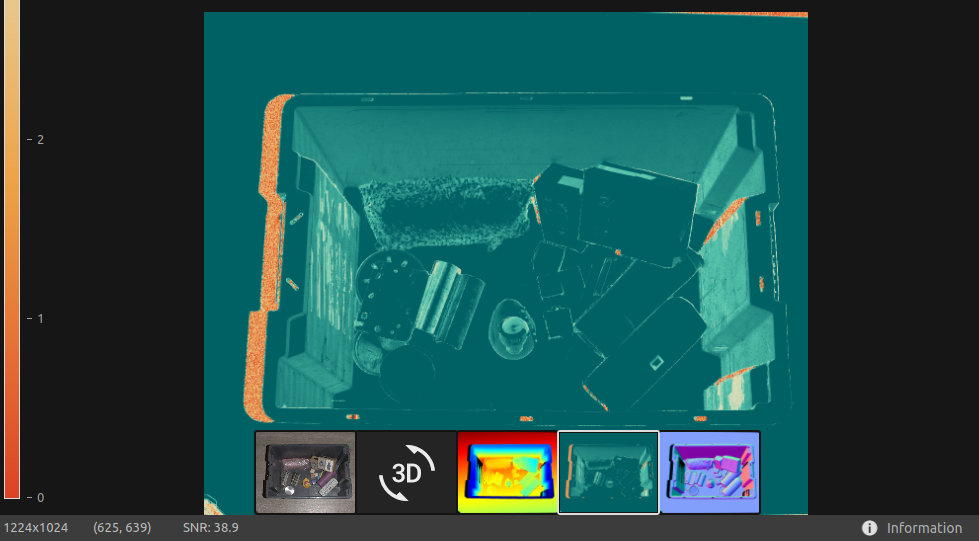
The color scale represents the variation in the SNR values. A pixel found at the higher end of the color scale represents a point associated with strong signal quality. For a point associated with a pixel found at the lower end of the color scale the ratio is more influenced by noise. Hence, these points involve higher uncertainty.
詳細は SN比値 を参照してください。
Normals
このビューはキャプチャ後、または ZDF ファイル読み込み後のシーンの法線マップを表示します。
画像上のピクセルにマウスポインターを重ねると画像座標・法線座標・ SN比値 を取得します。取得値は左下ステータスバーに表示されます。
Use zoom and pan features in the same way as described in the Color View.
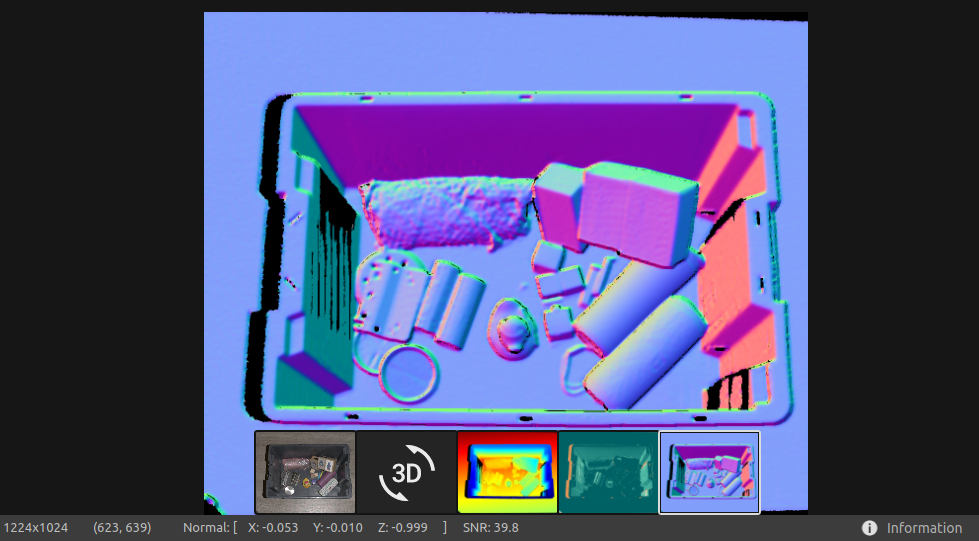
法線マップは RGB 成分で法線ベクトルを表現したシーン表面法線の 2D 可視化です。色のグラデーションにより表面の曲率・テクスチャ・物体間の遷移を評価しやすくします。
概要は Normals Article を参照してください。
続いて Toolbar をご覧ください。
Version History
SDK |
変更点 |
|---|---|
2.17.0 |
A fixed Z range slider is added to the Depth view. |
2.15.0 |
3D View に SN 比カラーマップと点群変換用 Transform 機能を追加。 |
2.14.0 |
3D ビューに 3D 軸インジケーター、レインボーカラーマップ、ポイントサイズ拡充を追加。 |
2.8.0 |
ポイントサイズ調整機能、SN 比マップ、法線マップを追加。 |