Available Views
There are five views available at the bottom of Zivid Studio. These views show the following features:
The point cloud
The color image
The depth map
The SNR map
The normal map
To navigate between views you can either
Use the keyboard shortcuts 1 through 5
Change manually at the bottom of the GUI by clicking on the thumbnails
Select from the drop-down menu in the top left corner
Each view has its own set of drop-down menus in the top left corner with different functionalities to explore.

Point Cloud
This view displays the point cloud of the scene after a 3D capture or after loading a ZDF file.
Use the left mouse button to rotate the point cloud.
Use the right mouse button to pan.
Zoom in or out by rolling the mouse wheel or, if available, by the middle mouse button followed by dragging the mouse.
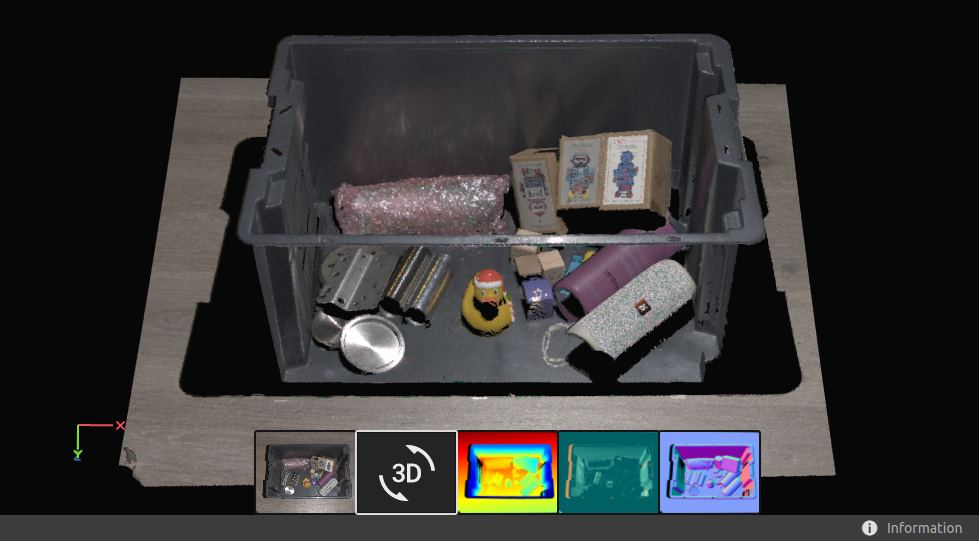
Choosing how the point cloud is colored (C, D, R and S) and toggling the mesh (M) on and off in this view helps evaluate the point cloud quality.
Other functionalities that affect the visualization of the point cloud are found in the top left drop-down menus:
The point size can be adjusted, which can be helpful for inspecting areas where textures are important.
If Depth (D) point cloud coloring is enabled, you can adjust the Z range to display only a specific section of the point cloud.
A transform can be applied to the point cloud to transform all points from the camera’s coordinate system to a chosen one. This can be useful when combined with different color modes to inspect the point cloud. You can either load a transform from file, or set it with the Region Of Interest. Note that this will affect the Depth and Normals views as well, as they are relative to the current coordinate system.
Read more about this in Transform.
If you have enabled the Region Of Interest Box, you can modify the visibility of it.
Color
This view displays the color image of the scene after a 2D capture or after loading a ZDF file.
Position the mouse pointer over a pixel in the image to get image coordinates and RGB values. The pixel values are displayed in the status bar in the bottom left corner of the window.
Zoom in or out by rolling the mouse wheel or, if available, by the middle mouse button followed by dragging the mouse.
Use the left mouse button to pan the view.
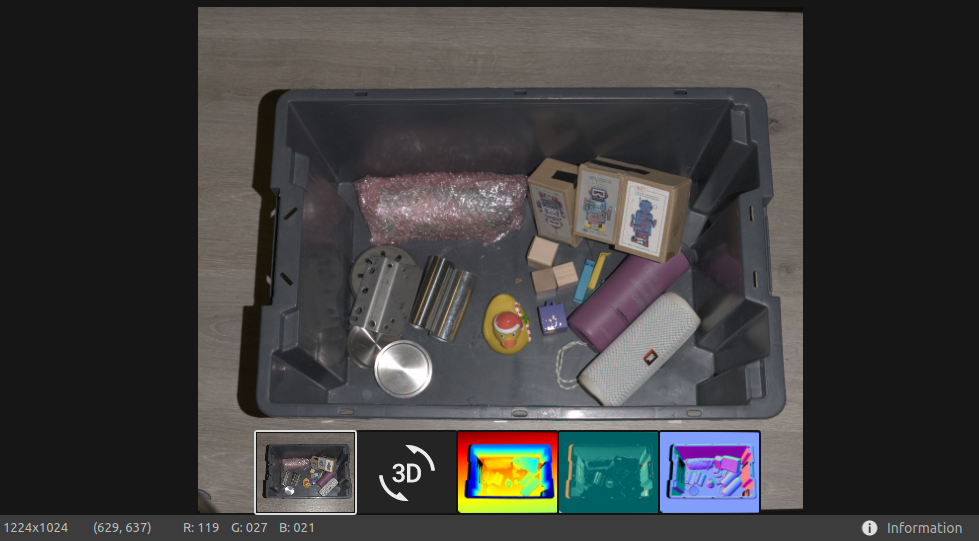
When doing a 2D+3D capture with different pixel sampling you can switch between the 2D image from the 2D capture and 3D capture in the top-left drop-down.
Depth
This view displays the depth image of the scene after a capture or after loading a ZDF file.
Position the mouse pointer over a pixel in the image to get image coordinates, XYZ values, and SNR values. The pixel values are displayed in the status bar in the bottom left corner of the window.
Use the drop-down menu located at the top left corner of the view to modify the Z range.
Use zoom and pan functionalities in the same way as described in the Color View.
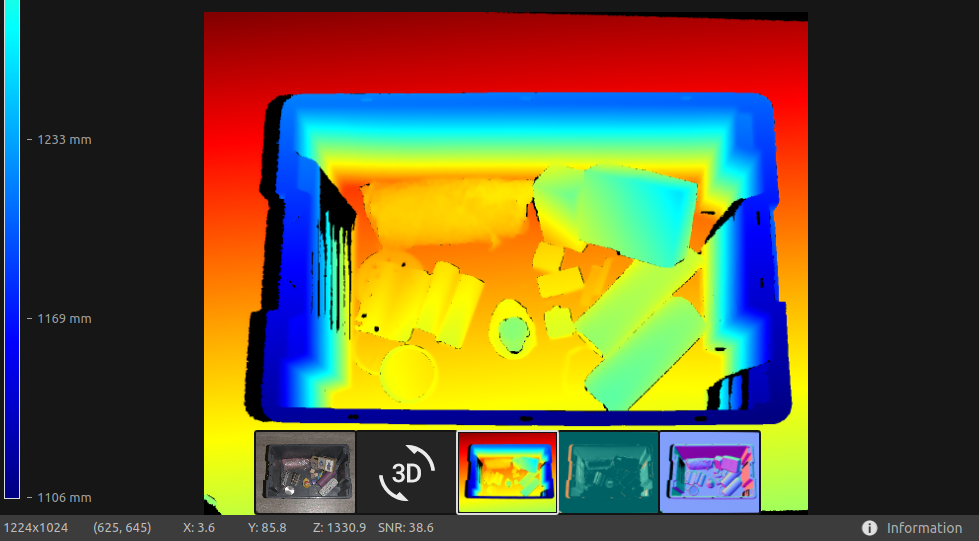
The color scale represents the distance variation along the z-axis from the camera to the surfaces of the imaged objects. To modify the range along the z-axis, you can use a fixed Z range in the top-left drop-down to narrow the color scale.
Signal-to-Noise-Ratio
This view displays the SNR map of the scene after a capture or after loading a ZDF file.
Position the mouse pointer over a pixel in the image to get image coordinates and SNR values. The pixel values are displayed in the status bar in the bottom left corner of the window.
Use zoom and pan functionalities in the same way as described in the Color View.
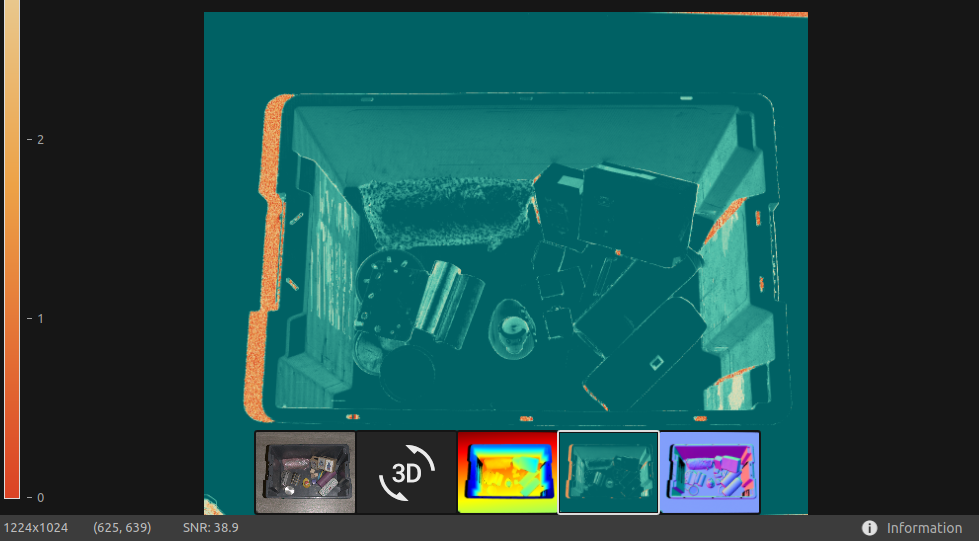
The color scale represents the variation in the SNR values. A pixel found at the higher end of the color scale represents a point associated with strong signal quality. For a point associated with a pixel found at the lower end of the color scale the ratio is more influenced by noise. Hence, these points involves higher uncertainty.
For a detailed explanation, see the SNR values Article.
Normals
This view displays the normal map of the scene after a capture or after loading a ZDF file.
Position the mouse pointer over a pixel in the image to get image coordinates, normal coordinates, and SNR values. The pixel values are displayed in the status bar in the bottom left corner of the window.
Use zoom and pan functionalities in the same way as described in the Color View.
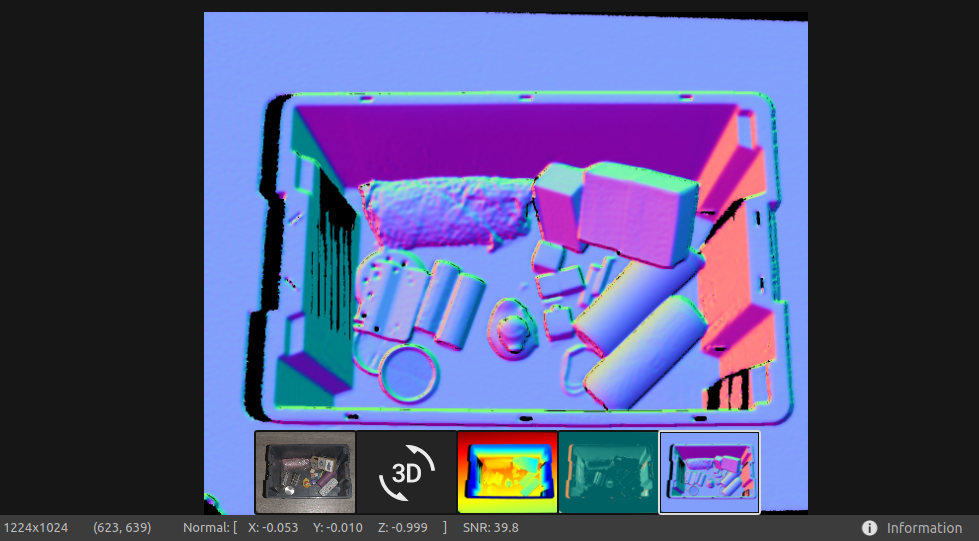
The normal map provides a 2D representation of the surface normals of a scene where RGB color components describe the normal vectors. It is helpful in inspecting surface curvatures, surface textures, and transitions between objects as the color gradients describe these well.
For an introduction to normals, see the Normals Article.
Continue reading about Zivid Studio in Toolbar.
Version History
SDK |
Changes |
|---|---|
2.15.0 |
SNR color map is added to 3D view, and Transform is added to transform the point cloud. |
2.14.0 |
3D axis indicator, rainbow color map and more point sizes are added to the 3D view. |
2.8.0 |
Adjustable point size, SNR map, and normal map are added. |