Available Views
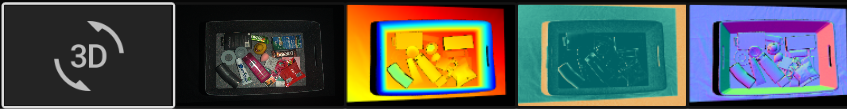
There are five views available at the bottom of the Zivid Studio GUI. These views show the following features:
The point cloud
The color image
The depth map
The SNR map
The normal map
To navigate between views you can either
Use the keyboard shortcuts 1 through 5
Change manually at the bottom of the GUI by clicking on the thumbnails
Select from the drop-down menu in the top left corner
Point Cloud
This view displays the point cloud of the scene after a capture or after loading a ZDF file.
Use the left mouse button to rotate the point cloud.
Use the right mouse button to pan.
Zoom in or out by rolling the mouse wheel or, if available, by the middle mouse button followed by dragging the mouse.
Turning color (C & D) and mesh (M) on and off in this view helps evaluate the point cloud quality. The point size is also adjustable through the drop-down menu at the top left. Adjusting the point size is for example helpful for inspecting areas where textures are important.
Color
This view displays the color image of the scene after a capture or after loading a ZDF file.
Position the mouse pointer over a pixel in the image to get image coordinates, RGB, and SNR values. The pixel values are displayed in the status bar in the bottom left corner of the window.
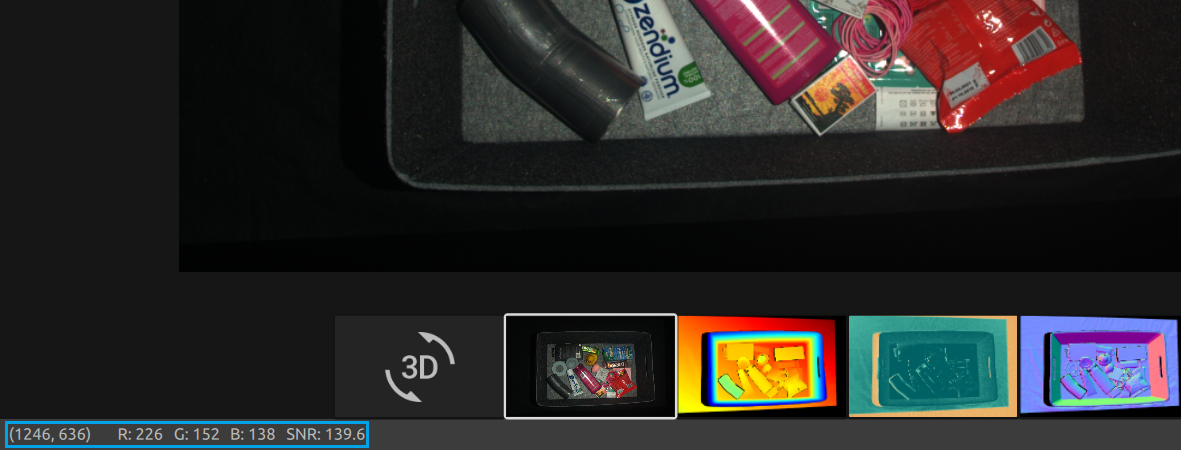
Zoom in or out by rolling the mouse wheel or, if available, by the middle mouse button followed by dragging the mouse.
Use the left mouse button to pan the view.
Depth
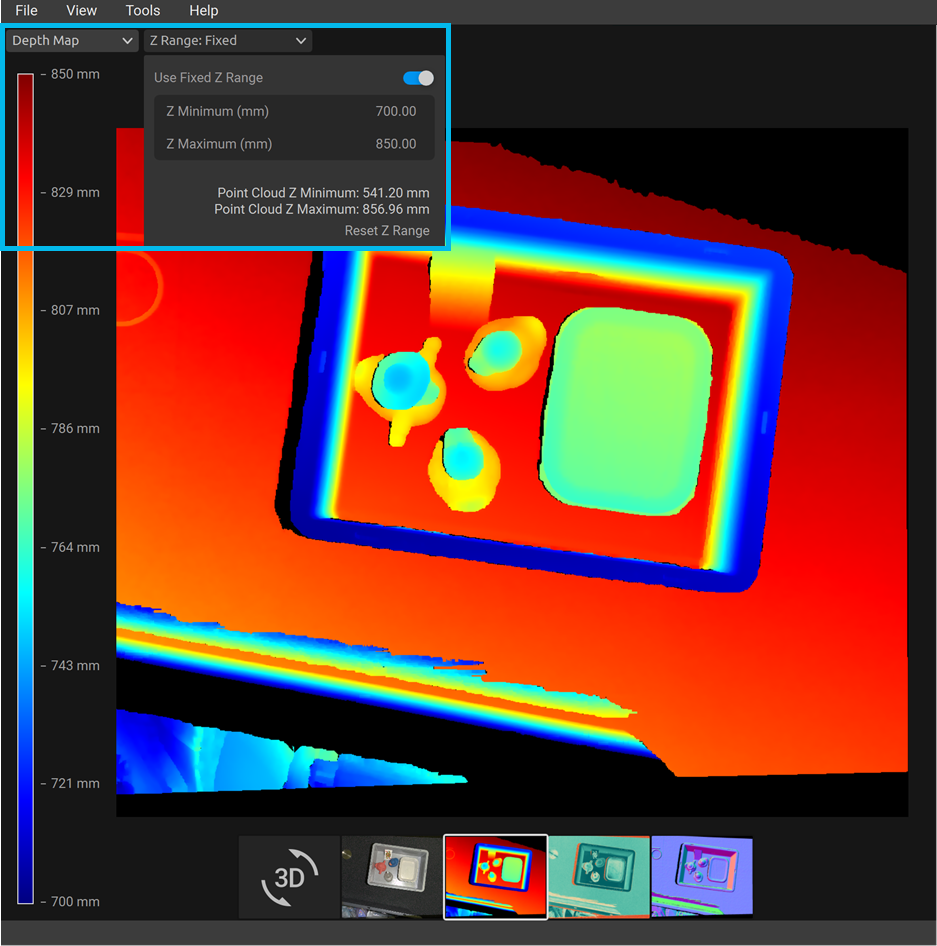
This view displays the depth image of the scene after a capture or after loading a ZDF file.
Position the mouse pointer over a pixel in the image to get image coordinates, XYZ, and SNR values. The pixel values are displayed in the status bar in the bottom left corner of the window.
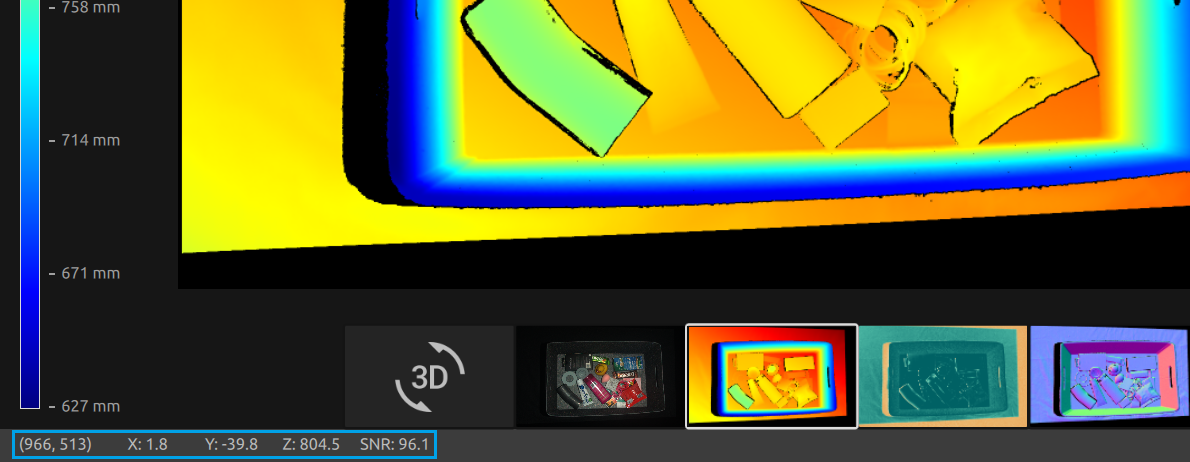
Use the drop-down menu located at the top left corner of the view to modify the Z range.
Use zoom and pan functionalities in the same way as described in the Color View.
The color scale represents the distance variation along the z-axis from the camera to the surfaces of the imaged objects.
Signal-to-Noise-Ratio
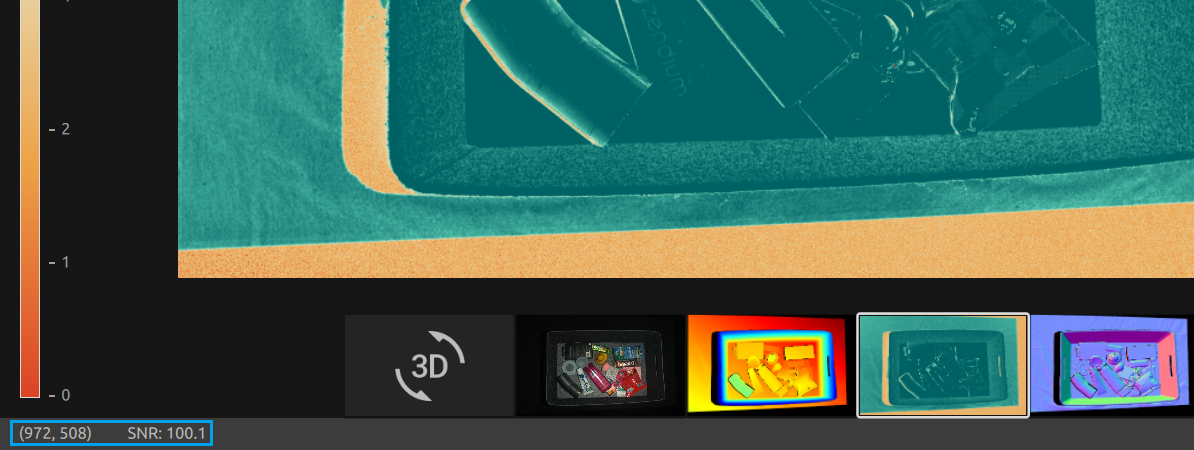
This view displays the SNR map of the scene after a capture or after loading a ZDF file.
Position the mouse pointer over a pixel in the image to get image coordinates and SNR values. The pixel values are displayed in the status bar in the bottom left corner of the window.
Use zoom and pan functionalities in the same way as described in the Color View.
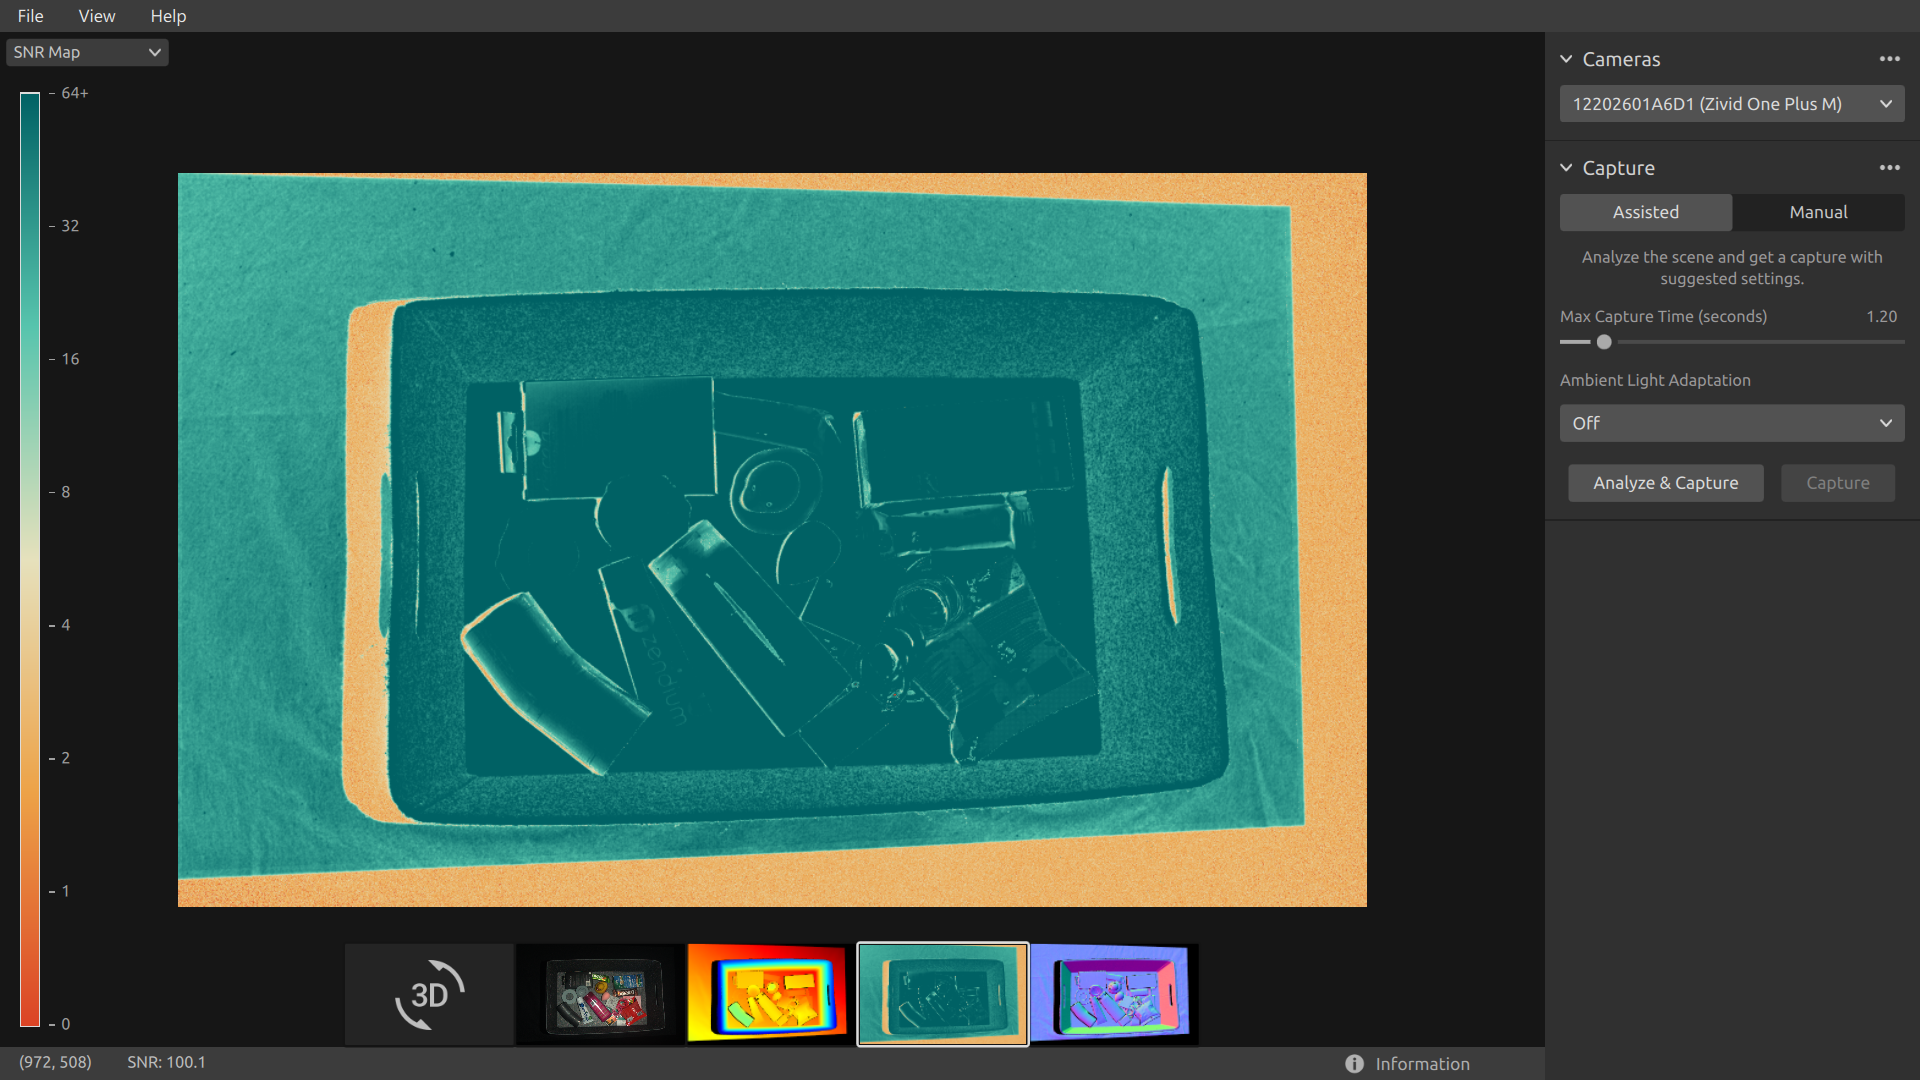
The color scale represents the variation in the SNR values. A pixel found at the higher end of the color scale represents a point associated with strong signal quality. For a point associated with a pixel found at the lower end of the color scale the ratio is more influenced by noise. Hence, these points involves higher uncertainty. For a detailed explanation, see the SNR values Article.
Normals
This view displays the normal map of the scene after a capture or after loading a ZDF file.
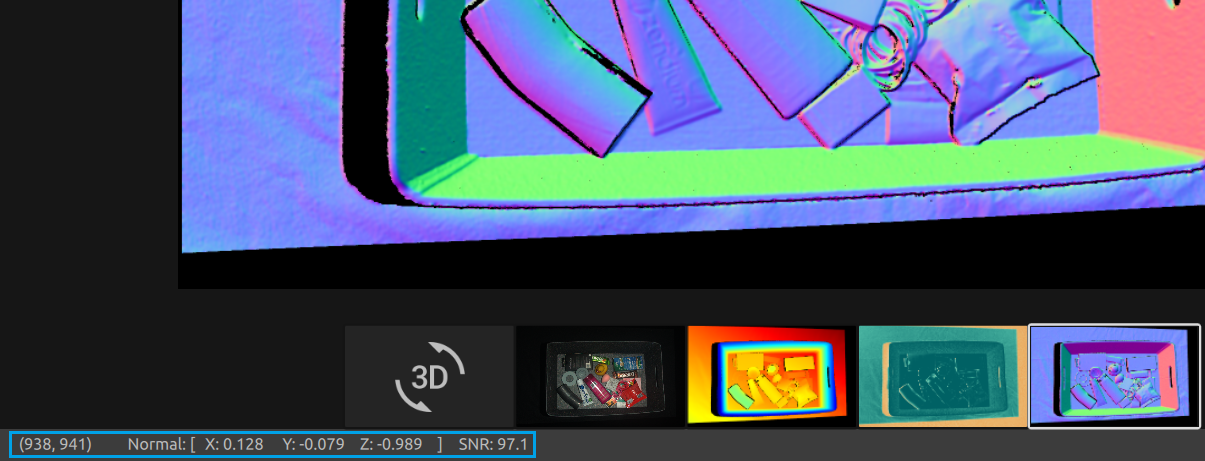
Position the mouse pointer over a pixel in the image to get image coordinates, normal coordinates, and SNR values. The pixel values are displayed in the status bar in the bottom left corner of the window.
Use zoom and pan functionalities in the same way as described in the Color View.
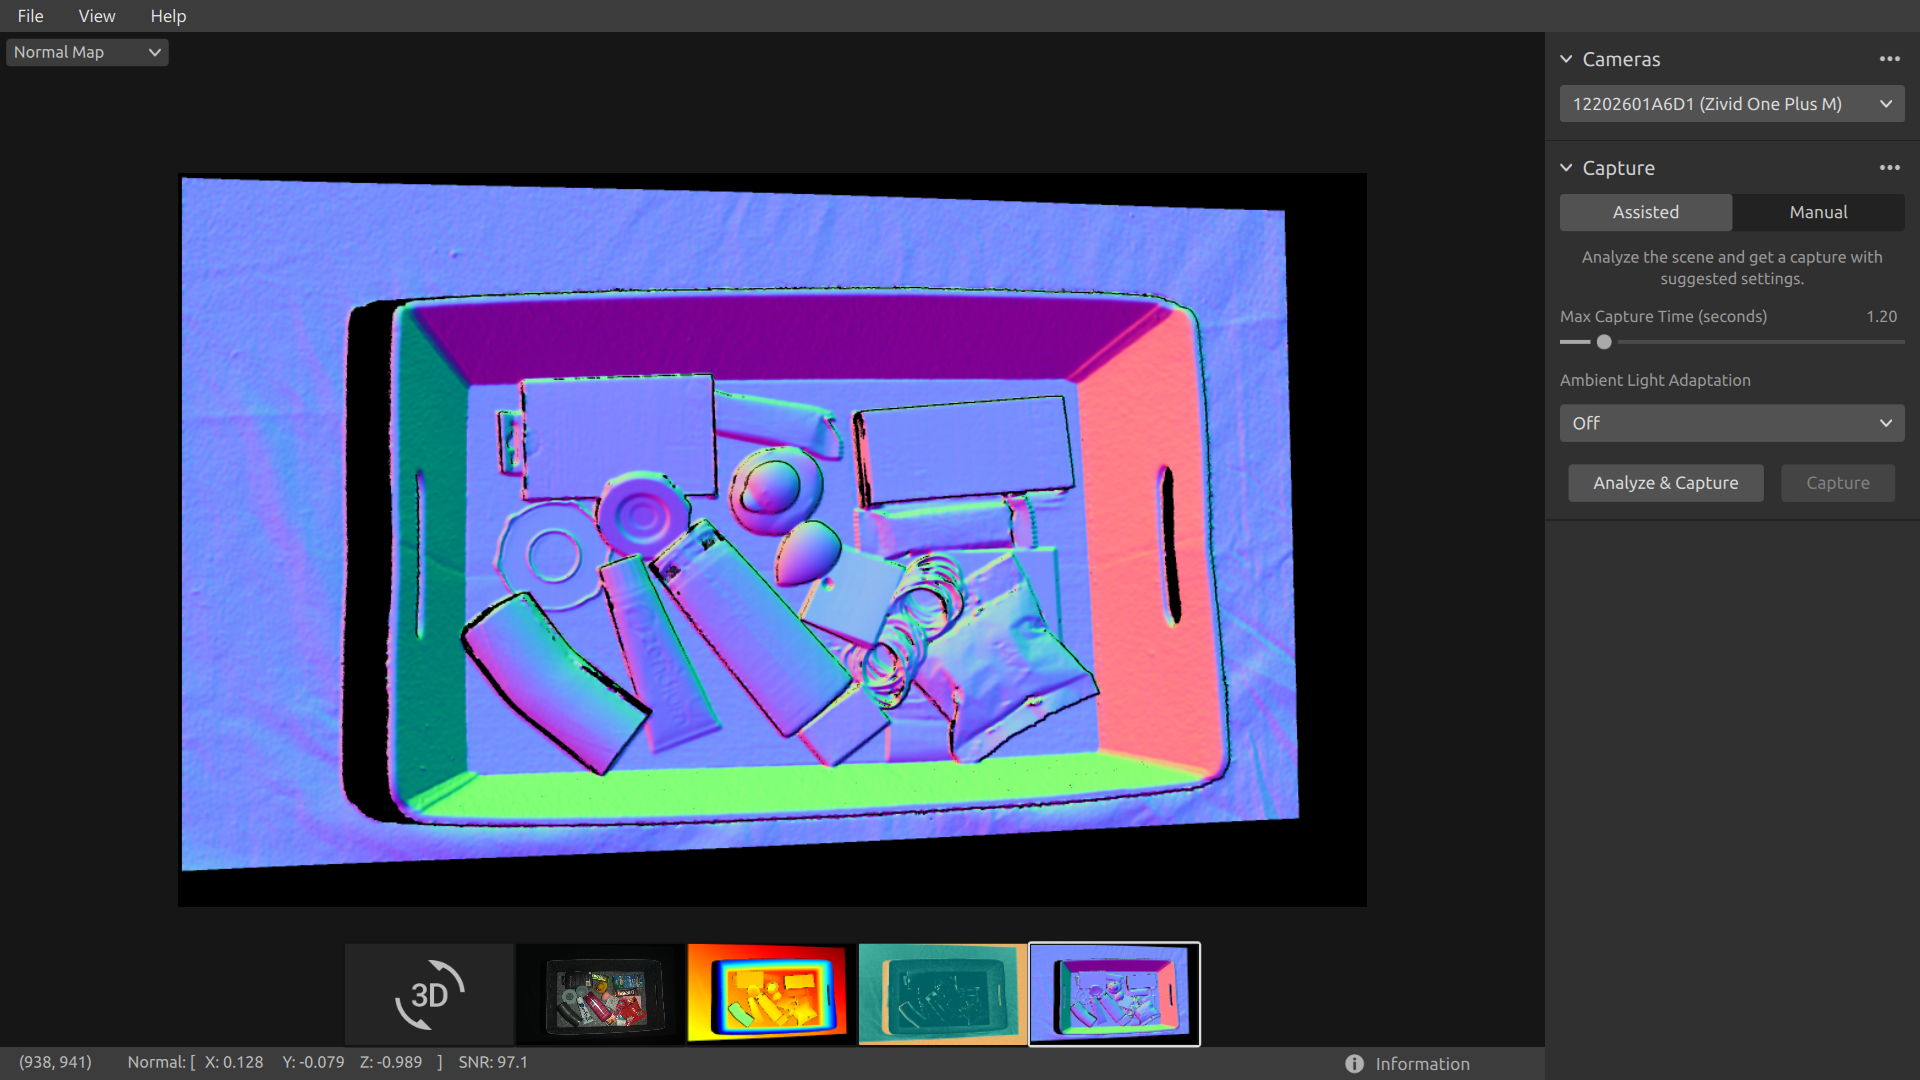
The normal map provides a 2D representation of the surface normals of a scene where RGB color components describe the normal vectors. For an introduction to normals, see the Normals Article. The relationship between the normal vectors and the color components are well visualized in the normal map by the bin walls and floor. This is because all the points on each surface have the normal vectors pointing more or less in the same direction. The color convention of the normal map is negatively aligned with the camera coordinate system. Hence, normal vectors represented by blue pixels point perpendicular towards the camera. Looking at the normal map, the blue pixels can be seen on the bin floor. These normals point in the negative direction of the Z-axis of the camera coordinate system. The status bar in the bottom left corner is then close to [0, 0, -1]. An example is outlined in the below image. Furthermore, the right bin wall is dominated by red pixels. These normals are negatively aligned with the X-axis of the camera coordinate system. This means that the surface has normal vectors pointing towards the left in the scene. Likewise, the bottom bin wall is colored green since the normals are pointing upwards in the scene. Hence, the status bar would respectively read close to [-1, 0, 0] for a red pixel and close to [0, -1, 0] for a green pixel.
As a result, the normal map is useful for seeing planes in the point cloud. The normal map is also helpful in inspecting surface curvatures, surface textures, and transitions between objects as the color gradients describe these well.
Continue reading about Zivid Studio: Toolbar
Dropdowns & Information
For each available view, there are dropdowns in the top left corner.

In the Point Cloud view, the dropdowns allow one to easily:
Toggle between Points and Mesh.
Change the point cloud color between RGB, Green, and Color.
Change the Point Size between Small, Medium, and Large.
Show Region of Interest Box (when ROI is used)
In the Depth Map view, it is possible to:
Change the Z Range in mm between Automatic and Fixed.
The Information panel can be expanded at the bottom right corner. It is available only after you load a point cloud from a ZDF file or capture a point cloud or a color image.
The top part of the Information panel shows Acquisition Time, Capture Time, and Point Cloud / Color Image Size.
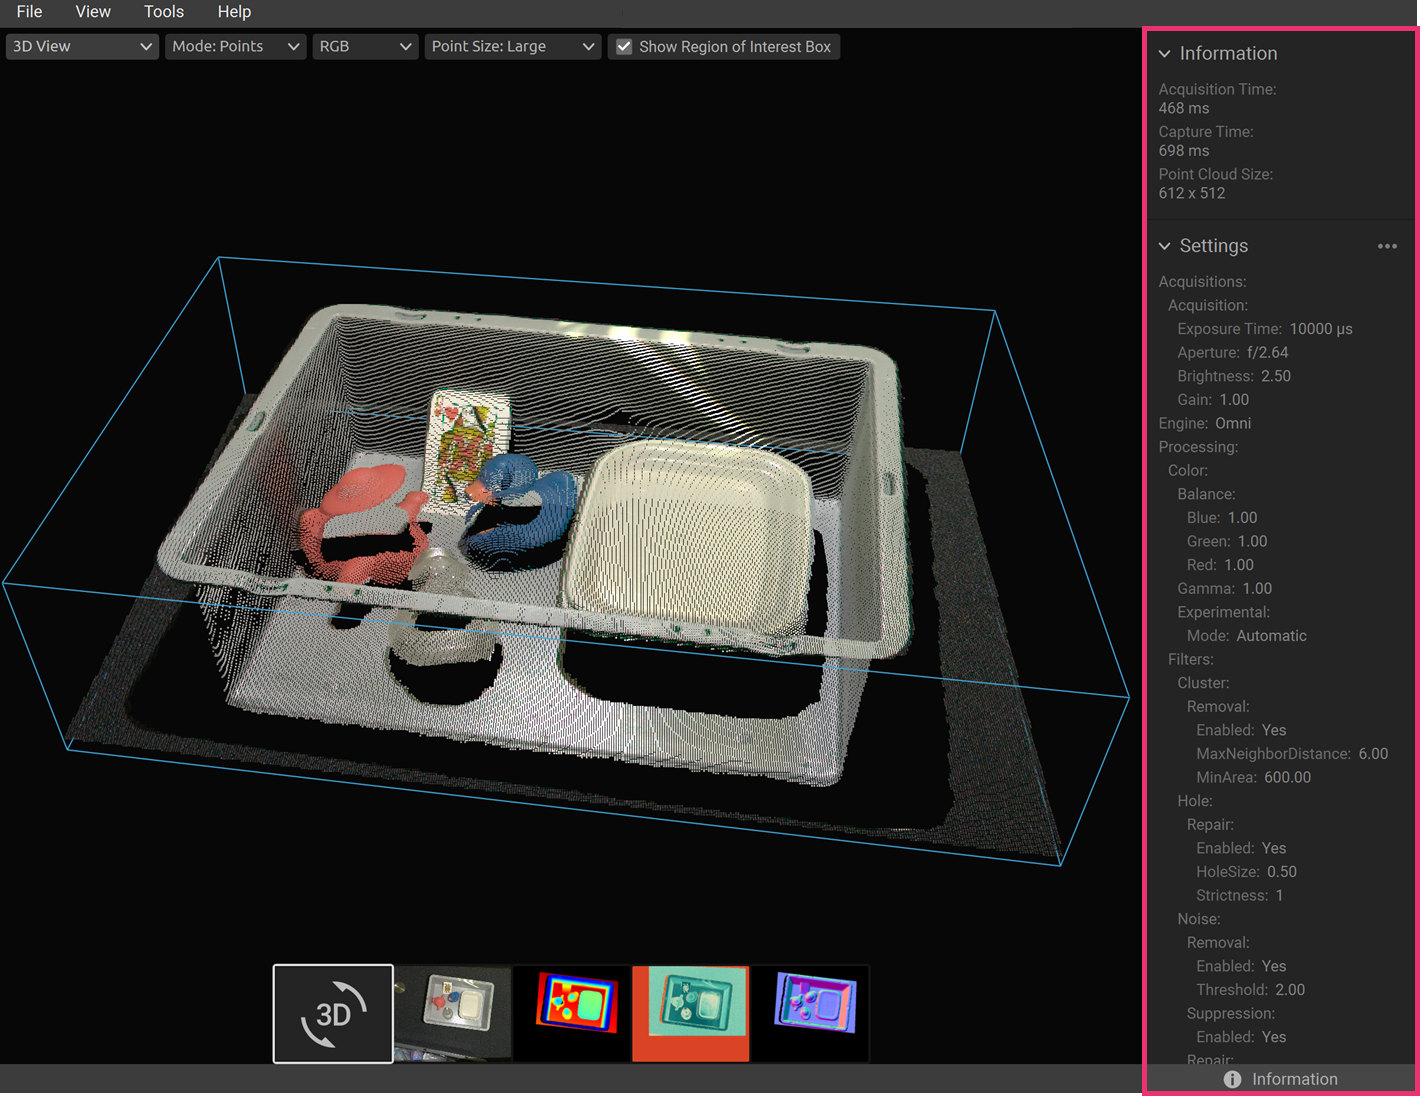
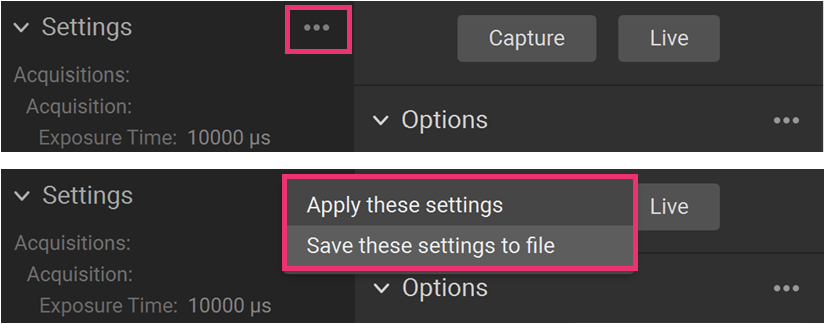
The bottom part shows the settings that were used in the capture. It is possible to save these settings to a file or apply them for use in the next capture.
Version History
SDK |
Changes |
|---|---|
2.12.0 |
Acquisition time is added to the information panel. |
2.8.0 |
Adjustable point size, SNR map, and normal map are added. |